As I write this post, I am sitting in an airport lounge coming off of a wonderful weekend spent with friends. During university, I seldom gave myself the time to sit down, relax, reflect, and allow a calm gratitude overtake me, which is what I have the opportunity to do right now. I suspect that intense nerves are on the horizon with my move to Madrid, so I am soaking up every moment of serenity while I can.
So, why…exactly…am I choosing to reflect about something data science-related? Does that not require significant brain power? For one, data is always on my mind. Secondly, since this is a project that was done quite a while ago, as well as a project I feel grateful I got to contribute to, writing about it does not bring me any particular stress. Finally, to be completely honest, this post is long overdue. It’s embarrassingly late for me to highlight this on my LinkedIn, and this blog needs more content anyways.
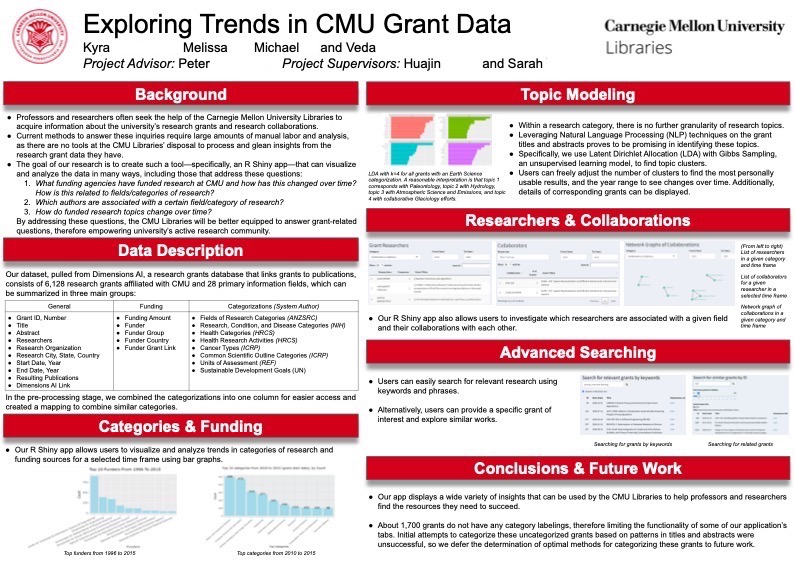
During the Fall 2020 semester, I took 36-490, the CMU Department of Statistics and Data Science’s research capstone course. In this course, students in groups of four work together with a Stat+DS faculty advisor and a client within CMU, such as a professor, in order to answer the client’s questions about a dataset. My groups’ client was the CMU Libraries. They had acquired data from Dimensions that outlines details about pretty much every research grant that CMU has ever been, well, granted. The client’s research questions primarily centered around finding trends in grant funding and topics, as well as identifying professor, departmental, and grant collaborations.
For my piece of the project, I decided to focus on topic modeling and visualizing topic trends over time. This is an important question as it can inform the CMU Libraries as to which kinds of grants seem to be the most popular, etc., so they can direct their resources/advice accordingly. Since all of this was to be integrated into a quick-loading, user-friendly R Shiny App that the CMU Libraries could use, I did not write big machine learning models from scratch or anything of the sort. Instead, I got the chance to engage in text processing, dive into the R libraries, and understand the models from a theoretical standpoint. I will also note that this was my first time using R Shiny.
I incorporated an unsupervised generative statistical model called Latent Dirichlet Allocation (LDA) to extract topics from the research grant titles and abstracts. In LDA, we assume that a given research grant title and abstract (more generally, a “document” or “bag of words”) can be summarized by a handful of words that are present in the title and abstract itself. Makes sense, right? We also assume that a singular topic is represented by multiple words. For example, the words “task,” “manipulate,” and “robot” together signal the topic “robotics.”
Using these assumptions, LDA determines clusters of associated words and uses them to represent topics. It then finds out which topic every document belongs to based on its content. So, how does it do all of this? Say it with me: by computing probabilities! To learn more on a beginner’s level, here’s a fun article. For those who desire something more in-depth, check out this article or this paper.
Going back to the app, after the user inputs some preferences–the number of topics they want to try and extract, the grant year range, and the grant category (i.e., “Computer Science”)–and LDA runs, a data visualization is presented to the user. The graph displays the top words for each discovered topic. Beneath the graph, there is also an abridged list of grants for each discovered topic. Continuing with the “Computer Science” category, running this model over the whole dataset and k = 8 topics gave word clusters that pointed to distinct topics such as robotics, machine learning, CS pedagogy, computational biology, CS theory, security, and others.
To see the screen captures of the final product and what my amazing teammates did, please click the following links! I will not be publicly linking the website since it is based off of an internal dataset and is not incredibly relevant to non-CMU individuals.
If you have any questions after reviewing all of the content, feel free to leave a comment!